Skip to Content

Research at V R Omega 7


Our research is the foundation of everything we do. Our dedicated team of experts is constantly exploring innovative ways to refine algorithmic trading techniques, develop advanced quantitative strategies, and optimize performance across various financial markets. By leveraging cutting-edge data analysis, machine learning, and artificial intelligence, we aim to uncover patterns, identify opportunities, and deliver exceptional results for our clients.

We believe that the financial markets are an ever-evolving landscape, and staying at the forefront of these changes requires a relentless pursuit of knowledge. Our commitment to research is not just about improving trading performance—it’s about shaping the future of algorithmic trading itself.


Seasonality Insights from Nifty IV based on historical IVs(2011-2023) 

This seasonality plot highlights the monthly patterns in implied volatility (IV) for Nifty over the past 12 years. Understanding these trends is crucial for options traders, risk managers, and market analysts to optimize trading strategies.

Key Observations:

🔹 High IV Months:

June & May 🔼: These months show significant IV spikes, suggesting periods of heightened uncertainty or event-driven volatility.

April 📈: Another historically volatile month, possibly due to Q4 earnings and macroeconomic events.

🔹 Low IV Months:

December & January ❄️: Historically low IV periods, likely due to the holiday season and lower market participation.

September & October 📉: Generally more stable, making them ideal for premium selling strategies like iron condors or credit spreads.


Deep Dive into Nifty IV & Market Events! 

Our analysis reveals explosive IV spikes 📈🔥 during major market events like the Eurozone Crisis (2011), Taper Tantrum (2013), Demonetization (2016), Elections (2019), COVID-19 Crash (2020), and Russia-Ukraine War (2022)!  

These moments of uncertainty created huge IV skews, presenting golden opportunities for long volatility strategies 🚀📉 before the event and mean reversion plays 🎯 after the panic subsided. 2020's COVID crash saw the largest IV surge in the last decade! 😱💰 Understanding these patterns can help traders time their option strategies better 🏆📊. Let’s use data-driven insights to decode market sentiment and optimize trading! 

Market Structure Shift – A Statistical Perspective 

The kurtosis trend across different periods shows notable shifts in market behavior. Higher kurtosis values 🚀 indicate fat-tailed distributions, suggesting increased probability of extreme price movements ⚠️, while lower values 📉 reflect a distribution with reduced tail risk. 

As seen in the recent data, periods with spiking kurtosis ⏫ may have experienced higher statistical dispersion, whereas declining kurtosis suggests a phase of lower return outliers 🔄. These insights help in understanding underlying shifts in market dynamics and distribution characteristics without relying solely on price action.


⚠ Disclaimer: 

This is NOT a buy or sell recommendation ❌ but purely a statistical analysis for educational purposes.

​​Always analyze multiple factors before making any market decisions

 Change in Market Structure – A Statist​ical Analysis

The Nifty close price distribution across multiple months indicates significant shifts in market structure. Observing the histogram patterns, we see variation in price clustering, suggesting potential changes in liquidity zones, volatility regimes, and participant behavior. 

The data hints at evolving support and resistance levels, with some months displaying bimodal distributions, possibly due to event-driven market reactions. Such insights help in understanding structural shifts rather than relying purely on price trends. 


⚠ Disclaimer: 

This is NOT a buy or sell recommendation ❌ but purely a statistical analysis for educational purposes.

Always analyze multiple factors before making any market decisions

The Behavior of Intrinsic Value and Time Value in Options Pricing


Abstract:

This paper explores the dual components of an option's premium—Intrinsic Value (IV) and Time Value (TV)—and their behavior across various strike prices.

IV is defined as the difference between the market price of the underlying asset and the strike price, applicable only when the option is in-the-money. Conversely, TV captures the premium paid for the potential of favorable price movements before expiration. Through detailed graphical analyses, this study illustrates how IV and TV contribute distinctly to the option's total value, providing insights into strategic trading decisions. 


The findings underscore the importance of understanding these components for effective options trading, particularly in selecting optimal strike prices and expiration dates. Future research directions include examining the effects of implied volatility and interest rates on TV, as well as the utility of dynamic hedging strategies influenced by these option pricing components.


Introduction

Options trading offers a versatile platform for investors to hedge against risk or speculate on the price movements of underlying assets. Central to understanding and leveraging options are their pricing components: Intrinsic Value (IV) and Time Value (TV).

This paper delves into the distinct behaviors of these two elements across various strike prices, elucidating how they cumulatively influence an option's premium.

Intrinsic Value (IV)  represents the actual monetary advantage gained from an option. Specifically, it is the amount by which an option is in-the-money (ITM). For call options, IV is calculated as the positive difference between the spot price of the underlying asset and the strike price. For put options, it is the positive difference when the strike price exceeds the spot price. IV is crucial as it provides the foundational value of an option; it is zero for out-of-the-money (OTM) options, rising as the option moves further into the money.          

Time Value (TV), on the other hand, reflects the potential for an option to become profitable or increase in profitability due to the movement of the underlying asset's price over time, up to its expiration. It is inherently speculative and is influenced by the time remaining until the option's expiration and the expected volatility of the underlying asset. TV is highest when the option is at-the-money (ATM) and diminishes as the option moves deeper into or out of the money, approaching zero as the option nears expiration.

This study employs graphical analysis to vividly illustrate the behaviors of IV and TV, providing a clear visual understanding of how each contributes to the total option premium. The insights garnered from this analysis aim to enhance options traders' strategies, particularly in the selection of strike prices and expiration dates, maximizing the efficacy of their trading decisions. Through a nuanced understanding of these fundamental components, traders can more effectively navigate the complexities of options markets.

Behavior of Intrinsic Value

Intrinsic Value (IV) is a fundamental component of an option's premium and serves as a direct measurement of the option's inherent worth at any given time.

The calculation of IV is straightforward: for a call option, it is the difference between the current price of the underlying asset (spot price) and the strike price of the option, provided this difference is positive. For a put option, IV is the difference between the strike price and the current spot price, again only if this difference is positive. This means that IV is always non-negative, reflecting actual profit potential from exercising the option.

The characteristic behavior of IV across different strike prices can be observed as follows:

  • Deep In-the-Money: IV is high because the difference between the spot price and the strike price is substantial. Here, the option's premium is largely composed of IV, with a minimal time value.
  • At-the-Money (ATM): As the strike price approximates the spot price, IV approaches zero. This is the threshold where the option transitions from having intrinsic worth to none at all.
  • Out-of-the-Money (OTM): IV remains zero. The strike price is either significantly higher than the spot price for calls, or significantly lower for puts, rendering no intrinsic profitability from exercising the option.


Graphically, the behavior of IV can be depicted as a step function that increases sharply when crossing from OTM to ITM, particularly for call options, and decreases similarly for put options. The graph typically shows a steep ascent (or descent) at the strike price where the option becomes ITM (or OTM), plateauing as the spot price moves further away from the strike price in a favorable direction.

This behavior underscores the binary nature of IV—it exists or it doesn't, depending solely on the relationship between the strike price and the market price of the underlying asset. As such, IV is most relevant for traders who are assessing the immediate, tangible value of an option, especially in scenarios where the option is likely to be exercised.

Behavior of Time Value  

Time Value (TV) is the other crucial component of an option's premium, encapsulating the extra amount that traders are willing to pay over the intrinsic value (IV) of the option.  

TV is rooted in the potential for the underlying asset's price to change favorably before the option expires, providing the option holder with a profit opportunity. Unlike IV, which is strictly defined by the current price relation to the strike price, TV is influenced by several dynamic factors:

  • Time to Expiration: The longer the time until the option expires, the higher the time value, as there is more opportunity for the underlying asset's price to move in a favorable direction.
  • Volatility of the Underlying Asset: Higher volatility increases the potential for significant price movement, which enhances the time value. Options on highly volatile assets command higher premiums due to the greater uncertainty and potential for profit.
  • Interest Rates and Dividends: Changes in interest rates can affect the cost of carrying positions, and expected dividends can influence underlying asset prices, both of which can impact the time value.

Behavior Across Different Strikes:

  • At-the-Money (ATM): TV is at its peak when the option is ATM. This is because the uncertainty and potential for the option to move in-the-money (ITM) is greatest. The spot price of the underlying asset is equal to the strike price, meaning even small price movements can significantly impact the option's profitability.
  • In-the-Money (ITM) and Out-of-the-Money (OTM): As options move deeper ITM or deeper OTM, the time value decreases. For ITM options, the increase in intrinsic value reduces the relative proportion of time value. For OTM options, the likelihood of becoming profitable decreases as the distance from the strike price increases, diminishing the time value.

Temporal Decay:

  • Theta Decay: TV also decays as the option approaches its expiration date, a phenomenon known as "theta decay." This decay is nonlinear and accelerates as expiration nears. The rationale is straightforward: with less time available, the probability of substantial beneficial movement in the underlying asset diminishes.


Graphically, the time value can be visualized as a bell-shaped curve centered around the ATM strike, with values tapering off towards either end as options move ITM or OTM. This visualization helps traders understand that while high IV can indicate a profitable exercise of the option, high TV represents potential future profitability based on market dynamics and time.

Understanding the behavior of TV is essential for options strategies that capitalize on changes in market volatility and time decay, such as calendar spreads, iron condors, and theta decay strategies. These strategies often aim to maximize the return on investment by carefully managing the trade-offs between IV and TV.

Conclusion  

The exploration of Intrinsic Value (IV) and Time Value (TV) in options pricing is foundational for traders aiming to harness the full potential of options markets.   

This paper has dissected these core components, elucidating how each contributes uniquely to the overall value of an option. Through detailed analysis and graphical representations, we've demonstrated the distinct behaviors of IV and TV across various strike prices and their implications for trading strategies.

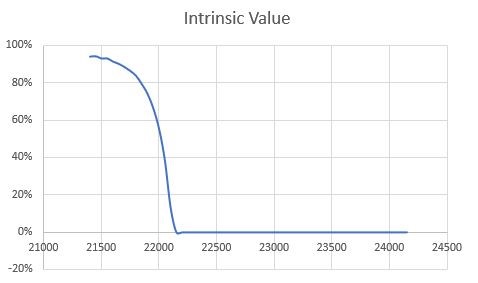
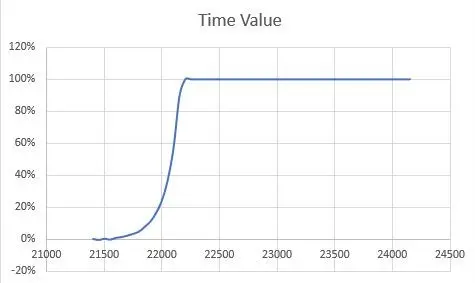
IV provides the essential value of an option when it is in-the-money, underscoring the actual profit that could be realized if the option were exercised immediately. Understanding this component helps traders assess the direct worth of their options based on current market conditions. On the other hand, TV encapsulates the potential future profitability of an option, factoring in the time remaining until expiration and the underlying asset's volatility. This speculative aspect of the premium is crucial for strategies that rely not just on the immediate price movements, but on the anticipated fluctuations over time.

The interplay between IV and TV is critical in shaping options trading strategies. Decisions regarding strike selection, timing of entry and exit, and the hedging of positions are all influenced by an understanding of these values. Moreover, the decay of TV as options approach expiration highlights the importance of timing in options trading, making it imperative for traders to not only choose the right positions but also to time their trades effectively.

Future research, as outlined, will further refine our understanding of these components by integrating factors such as implied volatility, interest rate changes, and cross-asset behaviors, which could lead to even more nuanced trading strategies. Additionally, advancing quantitative models and dynamic hedging techniques will aid traders in managing complex portfolios more effectively, adapting to market changes in real-time.

In conclusion, the dynamic nature of IV and TV offers both challenges and opportunities in options trading. By continuing to delve deeper into these aspects, traders can develop more sophisticated strategies that enhance profitability and manage risk more effectively. The ongoing study of these elements will undoubtedly continue to play a pivotal role in the evolution of financial markets.